You know that moment: the clock’s red, fingers flying, Carmina Burana in your ears. You slam the last numbers into a report, hit send, and…
Two hours later: “Can we change something so the management approves this release?”
Been there. Too many times. So, let’s make testing visible and understandable. Grab a coffee: this one’s going to be long.
We’ll talk about two flavours of reporting a little mixed, because it makes more sense to keep all reporting under one umbrella:
- quality reports (holistic, trend-oriented, mainly for (change)management, medium/long-term)
- testing reports (sprint/release/project…-focused, for team, project, organisation, trends and measurements, short/medium term)
So, here we go: The PPT Framework*
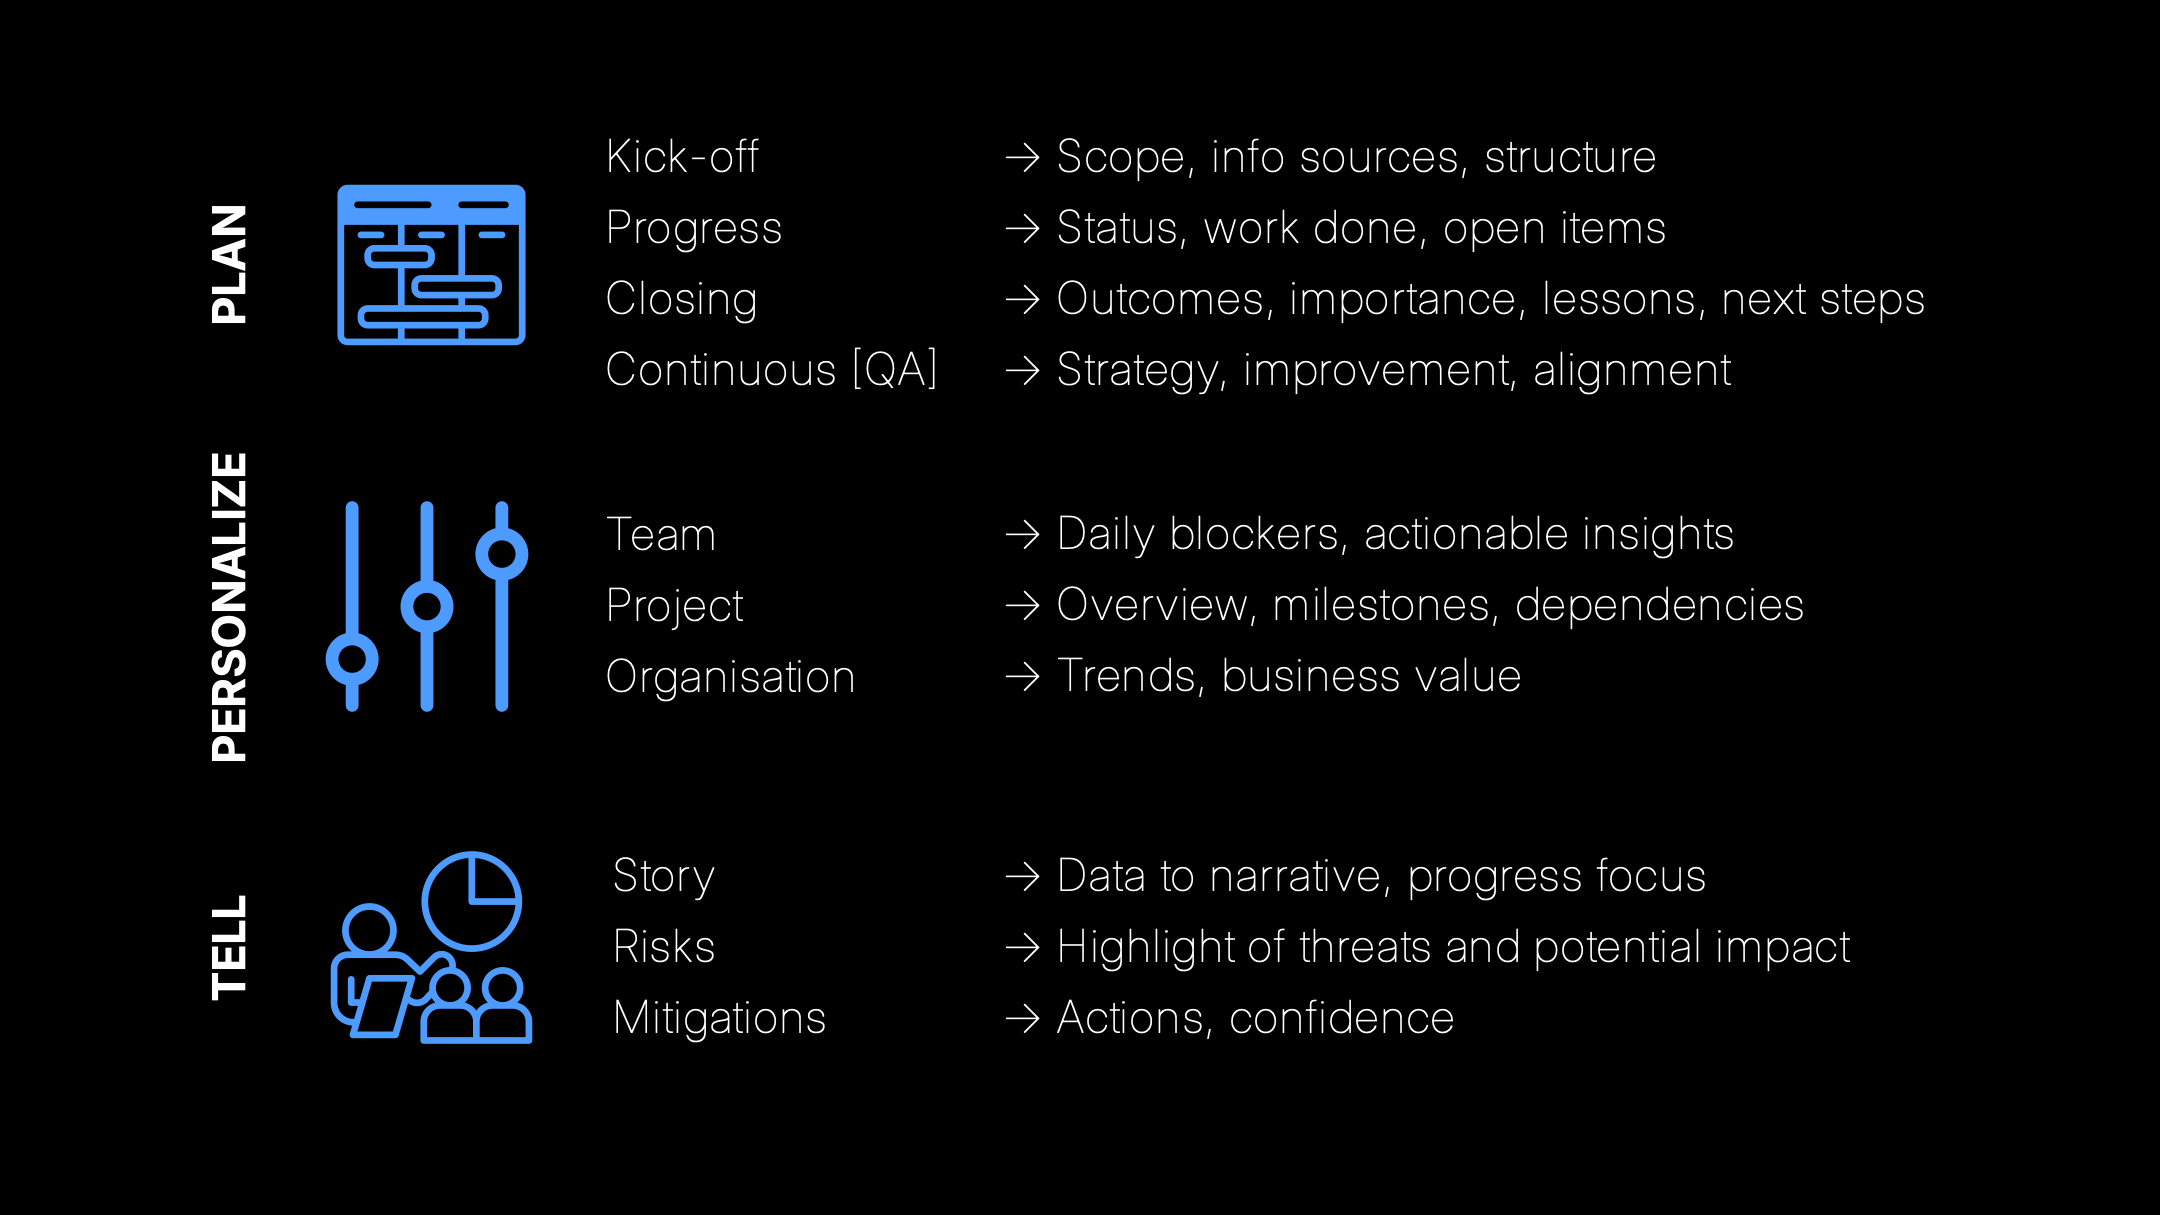
The PPT in details:
Plan
The reporting must be planned. Just like you plan your test execution, you need to think about what should be shared in each phase of delivery. We talk about progress and closing here because we need to see our goals from the start. That’s how we align our way toward them. Plan what to report during delivery, and what to report after delivery.
- Kick off: When everyone is in the room, tell them what information will be available and where. Define the scope of measurements and trends, why they matter, and where they’ll live. You don’t need everything in one place (though it helps), but you do need a clear Table of Contents with all relevant links. Be prepared -> this will become the bookmark everyone uses. Later, if things change, trust will drop. And we don’t want that.
- Progress: Up-to-date information should always be available: what’s done, what’s open, what’s next. We’ll see more examples of this in the Personalize section.
- Closing: After every cycle, hold a retrospective or lessons learned. We have to learn from our mistakes, and celebrate what went well. After release, show the outcomes of testing and analyse progress trends. Plan time for the improvements you want to implement for the next delivery.
- Continuous: This part is more quality-oriented. It’s about the long-term strategy. All improvements from Closing come right into this part. That’s why I said it’s more of a (change)management thingy. Keep a living metric set that evolves with strategy.
Personalize
Shape the message to the context and receiver (team, project, organisation). Same truth, different lens, because everyone needs a different level of detail.
- Team view (today/tomorrow clarity): What’s ready, what’s risky, where help is needed. Micro-level: flaky tests, environment stability, hotspots in code.
- Project view (peer, release confidence): Trend of completion vs. plan, risk register with owners, dependencies (both ways: who’s waiting on us, who we’re waiting for). It’s important not to just aggregate the pass rate, but also not to drown in tiny details. Focus on readiness by critical user journeys.
- Organisation view (strategy & outcomes): This depends on the size of the organisation. Here you can include escaped defects, results of root cause analyses, or cost-of-quality trends (prevention/appraisal vs. internal/external failure). Show the business value. Why testing matters and why it’s worth the investment.
Tell (Story, Risks, Mitigations)
-
Turn data into a story: about risks, choices, and consequences. This is the most important part. This gives the meaning to the numbers. All three parts of Tell depend heavily on the target (see Personalize).
-
For the team report, you don’t need a big story, they have it as a live show day-by-day, but give context, like: scope: green, schedule: yellow, resources: green. Add environment indicators if possible (pulled from monitoring dashboards).
-
For the project level the dependencies are key, describe the status briefly but focus on collaboration and how scope, schedule, and resources interact. Mention risks that could impact other teams.
-
For the organisation level, go higher: use indicators, colours (RAG scale, or whatever your company uses), and talk about what happened, where we stand, and where we’re going. Start with “What changed since last time?” Then describe the current status and its impact on scope, schedule, and resources (human, environment, data, etc.). Mention the biggest pain point, next steps, and challenges. Highlight only the most critical risks and how you plan to reduce or manage them. Make visible any pending decisions, show the available options.
Make your work visible. You and your team matter, show it to others. Reporting isn’t paperwork, think of it differently. Give it a spin.
Steal my PPT, use it, and tell me what felt awkward and what clicked.
As always, feel free to reply to this letter. I’ll read every message and answer your questions. Until next time!
Thanks for reading.
*Fun fact: I first named the framework “Plan Target Story,” but then realised that PTS by D might be… controversial.